
Hi Archinect,
Kennedy Elliot is up now, talking about using data in journalism.
From the OpenVis Conf website: Each week the Washington Post publishes five to ten graphics, many of which are interactive and nearly all of them have a web presence. The reach of the graphics department covers breaking news, investigative reporting, local and national news (and everything in between), features, daily news and enterprise stories. In this talk, Kennedy will explain the tools, coding practices, skills and process behind some of the interactive work we see on the Washington Post.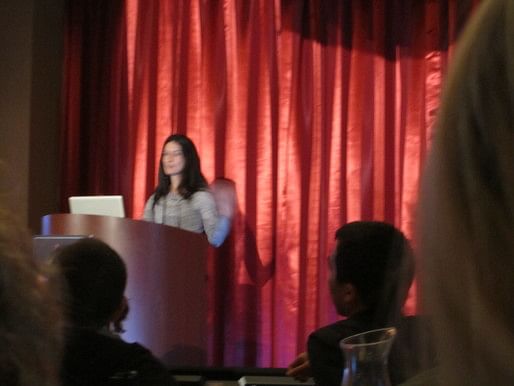
Elliot opens by admitting that the Washington Post is a "behemoth organization," with a ton of resources, so that talking about how they get all their graphics and interactives done might not be that applicable for everyone. She's therefore going to frame her talk in terms of using data in storytelling.
The team at WP includes writers, developers, artists, designers, etc., etc., but they are all journalists at heart. They're always working under deadlines, so they often re-use code and purpose-built tools, and like everyone else at OpenVis it seems, they use the D3 javascript library.
For collaborating with others in the newsroom, they use Google Spreadsheets a lot, and also Mr. Data Convertor, which "converts Excel data into one of several web-friendly formats, including HTML, JSON and XML." Other tools they use include Font Awesome and ProPublica.
As others have emphasized, Elliot's group re-uses code by building tools once so they don't have to redo work each time.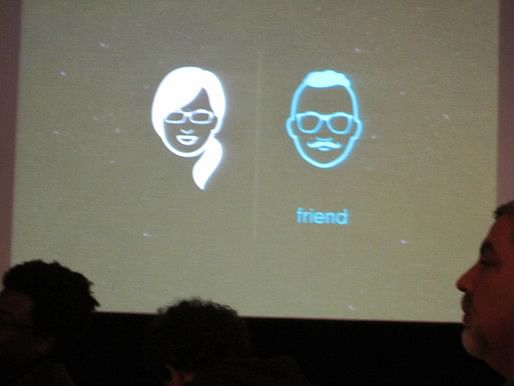
As Bostok emphasized, "get a friend," who can help critique your work from an outside perspective. And collaborate with people whose skills are different from yours.
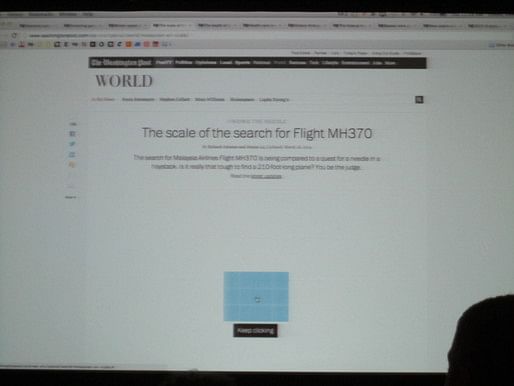
Think like a journalist: "A good interactive isn't always something that's really technically advanced. It's about connecting with the reader." For example, she shows "The Depth of the Problem," an amazing but very simple interactive that WP published to explain why the ocean depth makes it so hard to find the missing Malaysian Airliner.

Pretty amazing, for a single .jpg, right?
You might have a nagging feeling while researching a story, about some aspect that you don't quite understand, and we often push this feeling away, because we want to move on to more sophisticated ideas, and don't want to admit that we might not remember what we should have learned in high school biology or history. But listen to that feeling, Elliot says, because those can be the parts of the story that others also want and need to understand.
"Beware datasets that are easy to get." On the other hand, data that isn't immediately public is often accessible, if you pick the phone and call an expert, or the organization that holds the data. And FOIA what you can't get otherwise.
Elliot says she's heartwarmed by how open all the speakers have been about their mistakes and trial-and-error process; and she encourages everyone to "dispel conventions" and be willing to think outside the box. (By way of example, she excitedly mentions the new ax that shifts its center of gravity in order to make splitting wood much faster and safer.)
Another example of a lower-tech or less flashy approach: WP wanted to share information about all the children killed by deliberate gunfire in 2012 in the United States. This was a case where the gravity of the situation and the personal nature of it made the team not want to use shapes and stats, but instead the children's names. It could hardly be simpler than text, but it works.
Thanks for reading!
Lian


This blog was most active from 2009-2013. Writing about my experiences and life at Harvard GSD started out as a way for me to process my experiences as an M.Arch.I student, and evolved into a record of the intellectual and cultural life of the Cambridge architecture (and to a lesser extent, design/technology) community, through live-blogs. These days, I work as a data storyteller (and blogger at Littldata.com) in San Francisco, and still post here once in a while.


No Comments
Block this user
Are you sure you want to block this user and hide all related comments throughout the site?
Archinect
This is your first comment on Archinect. Your comment will be visible once approved.