
Follow this tag to curate your own personalized Activity Stream and email alerts.

New economic reporting compiled by Yardi Matrix suggests that apartment conversions will yield 122,000 or more new units in the United States in the coming years despite a recent turndown that’s been recorded in the market since January 1st. RentCafe has the latest data analysis to highlight a... View full entry

Construction workers died at a rate of 9.4 per 100,000 full-time equivalent workers in 2021, the BLS reported, down from 10.1 in 2020. That rate has hovered in that threshold for at least a decade. The new per capita figures are the lowest since 2011, but still don’t break the trend.
Worker death rate across all industries was 3.6 per 100,000, the highest since 2016.
— Construction Dive
Among the demographics, immigrant Hispanic & Latino workers were almost twice as likely to die than their U.S.-born counterparts, highlighting an underreported problem nationwide. Slips, trips, and falls were among the most commonly-recorded causes of death, followed by transportation... View full entry

The share of women in construction has hit a record high, according to the Bureau of Labor Statistics. Women surged into the industry starting around 2016, even as the number of men in construction lagged. ... What the heck changed? — The Washington Post
Florida, D.C., and Arizona lead the country in terms of the percentage share that women occupy in construction industry labor markets for each state, according to data from the Bureau of Labor Statistics. This can be partially attributed to a 117% increase in the number of Hispanic women employed... View full entry

The Council on Tall Buildings and Urban Habitat (CTBUH) has released data chronicling the prevalence of buildings with total heights taller than 150 meters (492 feet) in major metropolitan areas across the world. The statistics speak to several yearslong industry-wide trends as well as a... View full entry

A new study from the Council on Tall Buildings and Urban Habitat (CTBUH) has revealed important statistics that provide a clearer picture of the present state of tall mass timber construction across the globe. There are now a total of 66 completed mass timber projects worldwide totaling of... View full entry

The U.S. Census Bureau has changed its definition of an urban area, which will cause hundreds of existing urban areas to be reclassified as rural. The change is centered on a new methodology for how urban areas are calculated, with the number of housing units being used as the key metric, rather... View full entry

A digital record of earth’s man-made demise is about to begin thanks to an intervention in Australia called Earth's Black Box. A remote part of Tasmania is the home of the ominous new steel box that’s meant to capture and record climate data such as oceanic acidification, atmospheric carbon... View full entry

Architect and urban designer Matthew Frederick states in his book, 101 Things I Learned in Architecture School, "architects are late bloomers. Most architects do not hit their professional stride until around age 50!" Taking Frederick's statement into consideration how does age play into an... View full entry
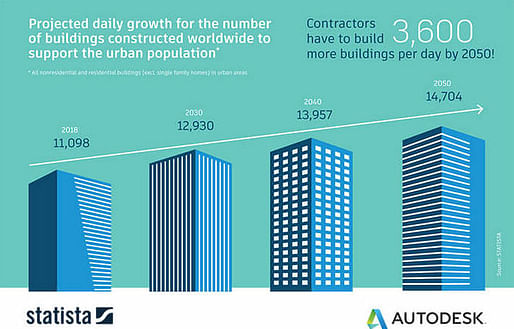
If you live or work in a city, then you probably see the impact of growing urbanization every day—gridlock traffic, construction cranes peppering the skyline, soaring housing costs. Sure, these are major challenges and annoyances for city dwellers, but they also represent a huge opportunity for the global architecture, engineering, and construction industry: one that requires building the future for a 10-billion-person planet. — autodesk.com
According to the United Nations Department of Economic and Social Affairs, 68% of the world population are projected to live in urban areas by 2050. Autodesk explores the implications for architectural growth in this timeframe with market research firm Statista. Take a look at the projected... View full entry

Neighborhoods with high vacancy rates rarely recover, according to the study. Vacancy is “first and foremost a symptom of other problems — concentrated poverty, economic decline, and market failure,” the study notes. That means the solutions must go beyond just tearing abandoned buildings down. The study urges local governments to use tools like “spot blight” eminent domain, vacant property receivership, and land-banking to speed up the transition from owner to owner. — CityLab
CityLab editor-at-large Richard Florida summarizes a new report by Alan Mallach of the Center for Community Progress about the increase of vacant properties and hypervacancy in cities across the U.S. in recent decades — another worrying aspect of the American housing crisis. The report assesses... View full entry
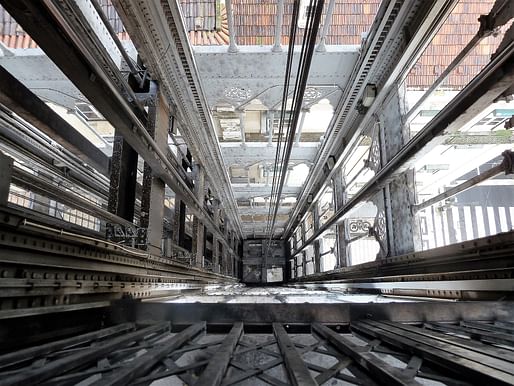
The first commercial passenger elevator was installed by Otis Elevator Company in 1857 and climbed at a glacial pace of 40 feet a minute, though it felt staggering at the time. Since then, we have come a long way both in terms of elevator speeds and in terms of the heights these elevators are... View full entry

Megacities—those urban centers crammed with more than 10 million people—would be well served to double down on their arboreal assets, according to a new paper in the upcoming issue of the journal Ecological Modeling.
A team of researchers led by Theodore Endreny of SUNY’s College of Environmental Studies and Forestry sought to quantify how leafy infrastructure pays dividends in 10 chock-full cities—and the extent to which those benefits could compound if those urban areas planted more trees.
— Citylab
You can check out the research paper here, as well as this 2015 report about the health benefits of more greenspace in urban centers. View full entry

The standard yardstick for judging housing affordability is to look at the median level of rents or home prices. As we all remember from statistics, the median is the observation in the middle of the distribution. And while for many purposes, it’s a reliable indicator of typical prices, in some neighborhoods, particularly those with a mix of expensive and cheap housing, the median is actually a weak indicator of affordability. — City Observatory
"For an illustration of this problem, imagine two neighborhoods. In both places, the median home costs $300,000. But in the first neighborhood, every home costs exactly $300,000, while in the second, there are a range of homes from $100,000 to $500,000. Although both neighborhoods have the same... View full entry

OK, so this would mean the way to make San Francisco as affordable as (say) Portland would be to either cut everybody’s salary in half, or fire half of them, or allow the city’s population to rapidly grow about 50 percent, to about 1.2 million, while the number of housing units increased even faster. — Michael Andersen, on Medium
In discussing San Francisco's rising housing costs over the years, journalist Michael Andersen re-emphasizes some points in this recent blogpost by a man named Eric Fischer, who took his own approach in analyzing the city's housing prices before 1979, when SF's rent-control rates began being... View full entry

Today the U.S. Census Bureau released its 2015 population estimates for counties and metropolitan areas. After volatile swings in growth patterns during last decade’s housing bubble and bust, long-term trends are reasserting themselves. Population is growing faster in the South and West than in the Northeast and Midwest, and faster in suburban areas than in urban counties; both of these trends accelerated in 2015. — citylab.com
Related stories in the Archinect news:See 2,000 Years of Urban Growth Around the World With This Interactive MapThe World’s Population Can Fit Inside New York CityCensus: LA is the nation's densest urban area, while New York ranks 5th View full entry