It turns out the government department with which we were partnering on our project decided that it would, in the future, hold an architecture competition on certain aspects of the canal project and thus would be unable to provide us with previous discussed materials (i.e. maps, climatological date, GIS, etc) as it would give unfair advantage if any of us were to enter any of these as yet unnamed competition.


Thus, we have moved entirely to a new site, still in Northern France, and still along a river, but more or less a good bit of starting over. Since our studio has been combined with fifth year students (who do a year long diploma project) this semester has been framed more as a research and proposal framing time. Which has been interesting and frustrating at times. That aside.

We had a three-day long Rhinoscripting Workshop with two consulting engineers out of London. I was skeptical of how much I would really be able to get out of it as I had tried teaching myself with good ole
Rhinoscripting "which was more like pounding my head against a brick wall and getting nowhere.

However it turned out that I ended up learning a lot and I think if someone were to ask me now if I knew rhinoscripting, I would say "yes". However
again, I definitely wouldn't have been able to make the most of the workshop without having already done the Summer of wall-to-head banging to get the basics of just how general stuff works.

Finally (the last 'however'), I think I've realized that I'm not as interested in it as I was to begin with. I think I knew this feeling would come. It's not that I thought I would discover the secret of architecture or something, I think I just thought it would be more interesting than it is. So I'm using it a good deal just with what I'm doing to analyse mapping, and it's valuable, but just as not exciting as I thought it would be.

I've expanded the couple scripts I've been working on quite a bit to do quite a number of things but in short:

1_A curve is evaluated (representing a linear infrastructure system, a river for example)
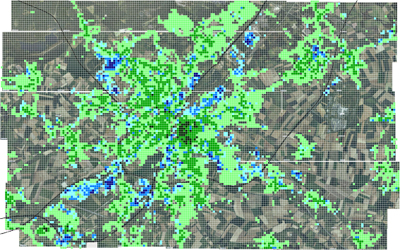
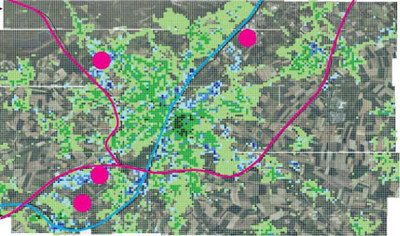
2_"Section" lines are drawn perpendicular to the curve until they reach a surface located around the curve (surfaces are representative of built areas, blue for industry and green for commerce/residential).
3_A second line is drawn from the endpoint of the previous line until it again hits a surface edge.
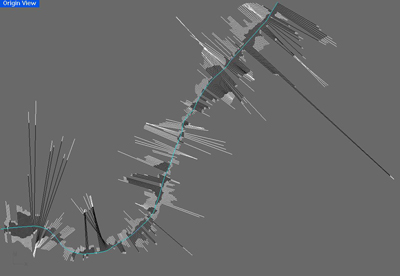
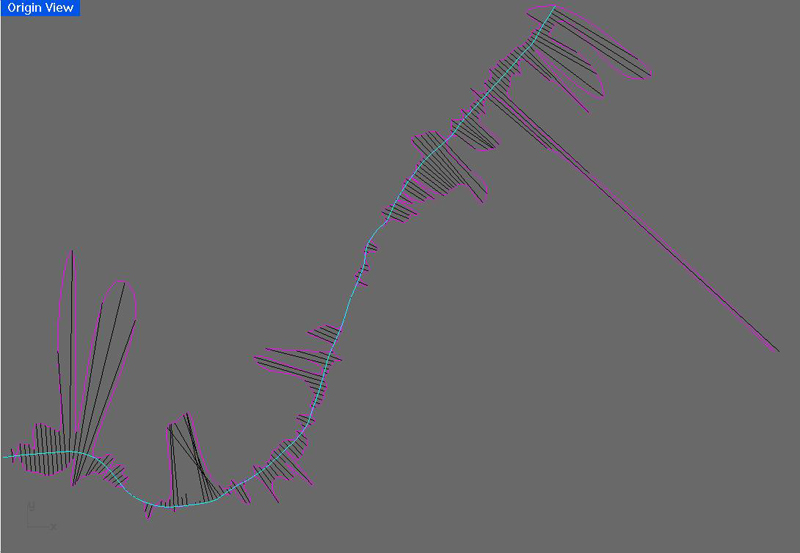
4_Finally a second curve is drawn at the origin of the same length as the existing curve being evaluated and the perpendicular curves created are copied on to this curve in order to make a straightened out diagrammatic representation of the linear infrastructure system.
The idea is to generate quantifiable data measuring the effect of a system on the built space. Where the black lines extend furthest, there is very little interaction between the infrastructure and the built area, where they are small or non-existent there is a heavy dialogue between the two (ex: a bridge/port on the river). The extent of the white or second lines measure the extent of development at that point, more or less measuring intensity. It should be interesting to understand this studio geographically as well as diagrammatically which is why I set it up to generate both.
From here I will identify specific places along the system that are peculiar for whatever reason and explore them further. The ultimate goal is to use this quantifiable data with the
Electric Field plug-in to beginning to modify/predict/invent how development will continue/change in the future with/without intervention.
Like I said, interesting, but not crazy interesting.
Oh yeah, I guess some people care about this, but it really just takes up way too much space:
Option Explicit
'Script written by
'Script version Saturday, November 01, 2008 11:54:20 AM
'First
'This script will evaluate an existing curve to place
'perpendicular curves at a specified interval. There
'will be two curves extending perpendicularly from the
'existing curve in opposite directions at each interval.
'Each curve will extend perpendicular from the curve
'until it reaches another existing object.
'Second.
'This script will draw an additional curve from the
'endpoint of each of the previously drawn curves,
'extending on the same path until it reaches another
'existing object. These new curves will be placed
'on a separate layer.
Call Main()
Sub Main()
'Select Curve
Dim strCurve
strCurve = Rhino.GetObject("Choose curve to evaluate", 4, True, True)
If IsNull(strCurve) Then
Exit Sub
End If
'Select Surfaces Around Curve to Evaluate
Dim arrSurfaces
arrSurfaces = Rhino.GetObjects("Choose surfaces around curve to evaluate", 8, , , True)
If IsNull(arrSurfaces) Then
Exit Sub
End If
'Select Curve Objects Around Curve to Evaluate
Dim arrCurves
arrCurves = Rhino.GetObjects("Choose curves around curve to evaluate", 4, , , True)
If IsNull(arrCurves) Then
Exit Sub
End If
'Find Total Curve Length
Dim dblCurveLength
dblCurveLength= Rhino.CurveLength(strCurve)
'Specify Interval
Dim dblInterval
dblInterval = Rhino.GetReal("Create sections at what interval?", 1.0, 0, dblCurveLength)
'Draw New Line
Dim arrNewVector, strNewLine, arrNewPoints
arrNewVector = Rhino.VectorAdd (Array(0,0,0), Array(1,0,0))
arrNewVector = Rhino.VectorUnitize(arrNewVector)
arrNewVector = Rhino.VectorScale(arrNewVector, dblCurveLength)
strNewLine = Rhino.AddLine(Array(0,0,0), arrNewVector)
'Divide New Line
arrNewPoints = Rhino.DivideCurveLength(strNewLine, dblInterval)
'Add Layers to Receive New Curves
Rhino.AddLayer "Distance Curves"
Rhino.AddLayer "Extent Curves", RGB(255,255,255)
'Choose Folder for Animation
Dim strSaveFolder
strSaveFolder = Rhino.BrowseForFolder("C:\Documents and Settings\Travis\My Documents\School\ESA\Atelier New", "Choose File Folder to save animation jpeg's")
If dblInterval


No Comments
Block this user
Are you sure you want to block this user and hide all related comments throughout the site?
Archinect
This is your first comment on Archinect. Your comment will be visible once approved.