
Since 1995, the American Institute of Architects has conducted a monthly index detailing trends in billings by architecture firms in the United States. Over time, the Architecture Billings Index (ABI) has become a valuable metric for charting the economic health of the profession, with Archinect reporting on the index monthly since 2012.
To help readers better understand how metrics from ABI translate into the reality of design and construction and to equip them with the tools to interpret the numbers, understand their source, and delineate between various categories, we have assembled a series of questions and answers pertaining to the index.
The AIA/Deltek Architecture Billings Index (ABI) is a monthly index that tracks whether billings in architecture firms increased, decreased, or remained stable compared to the previous month. While originally focused on billings, the index now also tracks design contracts and inquiries.
In addition to headline national figures on billings, design contracts, and inquiries, the index includes metrics for various key subcategories. The index breaks down improvements or declines in business conditions across the four census regions of the United States: Northeast, Midwest, West, and South, as well as national business conditions for three sectors: Commercial/Industrial, Institutional, and Residential.
The AIA/Deltek Architecture Billings Index (ABI) is a monthly index that tracks whether billings in architecture firms increased, decreased, or remained stable compared to the previous month.
In the ABI, ‘Billings’ is measured as the dollar value of monies billed to clients by the architect in that month. ‘Design Contracts’ is measured as the dollar value of new contracts signed between the architect and their clients in that month. ‘Inquiries’ is defined as the volume of inquiries for new work received by the architect in that month, which may include bids, requests for proposals, solicitations, or invitations for interviews.
To produce the ABI, the AIA conducts a monthly survey of firms to measure their business conditions, known as the AIA Work-on-the-Boards survey. On the first business day of each month, participating firms are emailed the survey questions asking them whether billings, contract values, and inquiries during the previous months have increased notably (by 5% or more), remained stable (+/- 5%), or declined notably (by 5% or more). The results are tabulated using a diffusion index (explained below) and published by the AIA. Each month, Archinect reports on the latest data.

As mentioned above, the ABI is generated from surveys completed by the AIA Work-on-the-Boards panel. The panel is open to owners, principals, and partners of AIA member firms. As of 2024, there are approximately 21,000 AIA member firms, with approximately 500 firms participating in the survey. According to the AIA, firms selected for the survey “reflect the characteristics of the broader universe” of firms in their database in terms of size, location, and building-type specialization. While firms in the survey principally provide architectural services, they may additionally provide engineering, interior design, landscape architecture, planning, urban design, and construction-phase services such as construction management.
To produce the ABI, the AIA conducts a monthly survey of firms to measure their business conditions, known as the AIA Work-on-the-Boards survey.
In a 2014 report on the ABI, the AIA offered the following insight into the firms who participated in the ABI survey: “Nearly two-thirds of firms on the survey panel have a nonresidential building specialization (37 percent institutional, 25 percent commercial/industrial), while just 20 percent specialize in a combination of single-family construction, multifamily construction, and home improvements. The remaining 18 percent of firms participating in the ABI panel have a mixed specialization; they do not receive half or more of their billings from any single major sector.”
The ABI is what is known as a ‘diffusion index,’ commonly used in economics to gauge the overall direction of an economic indicator over time; in this case, increases and decreases in business conditions. If a respondent to the ABI survey notes that billings increased notably from the previous month, that is considered a ‘positive’ indicator. A respondent reporting stable billings from the previous month is a ‘no change’ indicator, while a respondent reporting that billings decreased notably is considered a ‘negative’ indicator. Each month, the ABI contains a score, which is calculated as a percentage of firms reporting a positive indicator plus half the percentage of firms reporting a no-change indicator.
As an example, if 60% of firms report billings notably increased on the previous month, and 10% reported that billings remained stable, the score would be (60+5), giving an ABI score of 65. If only 10% of firms reported billings notably increased and 36% reported that billings remained stable, the score would be (10+18), giving an ABI billings score of 28.
Each month, the ABI contains a score, which is calculated as a percentage of firms reporting a positive indicator plus half the percentage of firms reporting a no-change indicator.
If the percentage of firms reporting an increase in billings is equal to the percentage reporting a decrease in billings, the resulting score will always be 50. Therefore, 50 is an important number in the ABI. If an ABI score is above 50, it means business conditions have improved versus the previous month. If the score is below 50, business conditions have deteriorated.
The same process is applied across all metrics in the ABI, whether they be billings, contract values, inquiries, or regional or typology metrics.

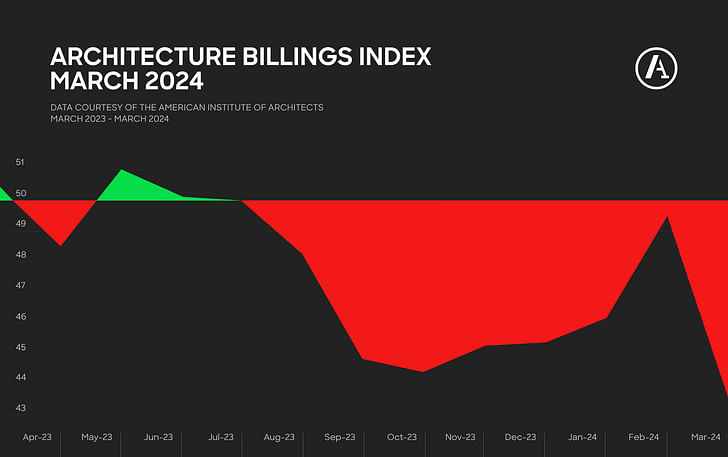
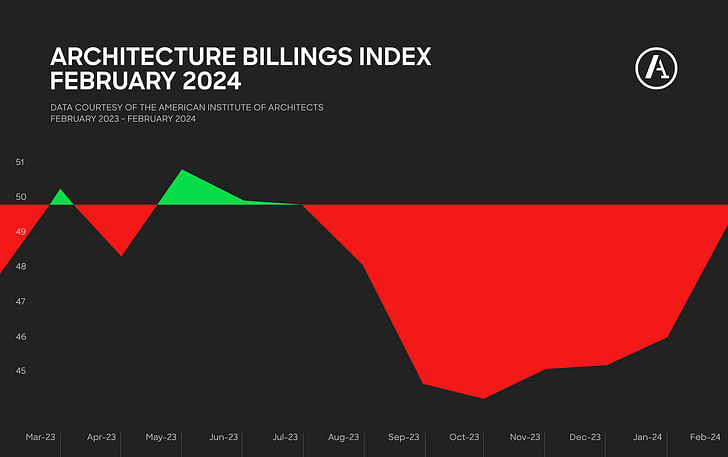
In January 2024, the ABI billings score was 46.2. In February 2024, the score increased to 49.5. While February’s score was higher than January’s, this does not mean that billings increased in February. It means that while billings still declined from January to February, the rate of decline was not as severe as from December to January. Billings will only ever increase on the previous month if the score is above 50.
It is important to remember that inquiries, contract signing, and billings happen at different stages of a given architectural project. The AIA has previously noted that there is indeed a correlation between the numbers and estimates that when firms report an increase in the dollar value of design contracts, an increase in billings follows within the next six months. In other words, if the monthly scores for contracts in the ABI begin to surge, you should expect to see a surge in billings scores approximately six months later.
It is also worth noting that ‘inquiries’ are not a perfect predictor of contracts or billings. As the AIA notes, the measure of whether inquiries have increased, decreased, or remained stable can be subjective on the part of the architect and more open to feelings, intuitions, or readings of intentions versus the objective dollar value of a contract or invoice. The inquiries score in the ABI, therefore, does not correlate as reliably to billings and contract values as billings and contract values correlate to each other.
If the monthly scores for contracts in the ABI begin to surge, you should expect to see a surge in billings scores approximately six months later.
When asked about the tentative relationship between inquiries and billings, the AIA further told Archinect that while a firm may receive many inquiries that do not lead to projects, one single inquiry might also lead to a high volume of billable hours. In addition, AIA noted that a slowing economy results in slowing construction activity, making it harder for developers to acquire financing for construction projects. When developers have fewer active projects, and employ fewer architects, AIA has observed that such developers typically increase their inquiries to architecture firms, reasoning that when money is tight, clients shop around more. As a result, AIA told Archinect that when billings dip below 50 for an extended period of time, inquiries will usually stay above 50, as has happened in recent months across 2024.
It is important to note that the regional scores (Northeast, South, West, and Midwest) do not relate to the location of projects but the location of architecture firms reporting the data. If a firm with offices in multiple locations is reporting data, the firm is asked to report data for each particular location and not for the entire firm. Nonetheless, the AIA has noted that “most projects at a given firm location correspond to the region in which that office is located. This is true even for larger architecture firms that generally have multiple offices, each serving separate geographical areas.”
The AIA describes the ABI as “a leading monthly economic indicator that uses proprietary AIA data to predict nonresidential construction activity 9–12 months ahead.” The institute argues that over time, U.S. architecture billings have been an accurate leading indicator of national trends in building construction, owed to the fact that, according to the AIA, 75% of nonresidential buildings are designed by architects. Trends in new contracts and billings in firms, therefore, serve as an indicator for future construction.
As noted, AIA data suggests that billings activity leads to construction activity by 9–12 months. In particular, the commercial/industrial ABI leads commercial/industrial construction spending by 11 months, while institutional ABI leads institutional construction spending by 7 months.

Not always. The AIA notes that there are some instances where firm billings and contracts do not translate into construction activity. Projects may be stalled or abandoned even after progressing through the design phase and being billed as such. A 2013 survey by the AIA found that 11.5% of firm billings fell under this category.
In addition, firms in the United States may be signing contracts and billing work for projects to be constructed internationally. Naturally, these projects do not manifest in U.S. construction data. The same 2013 AIA survey found that 8% of billings fell into this category. Finally, architecture firms may be billing clients for services beyond the scope of construction, including planning and predesign, or maintenance.
Given its stated aim as a useful predictor of U.S. construction activity, the study of the ABI can be an important planning tool for architecture firms that specialize in construction-stage work, offering insights into where to direct marketing, networking, staffing, and operational resources across geographies and sectors.
A reading of the ABI can, therefore, inform aspects of architectural business decisions, from who and where to hire, which typology of project to prioritize in bids, or along what timeline initial inquiries may lead to design or construction activity
Moreover, given the cyclical nature of the economy, the ABI serves as a broader consistent metric for understanding the economic health of the profession over several years, such as whether the industry is at a peak growth, market peak, peak decline, or market trough. In Archinect’s 2023 Year in Review, for example, the ABI served as a central metric for our analysis of the decline in the economic health of the profession through the second half of 2023, particularly when correlated with other economic indicators such as construction spending or architectural employment activity.
By understanding how early indicators such as project inquiries and design contracts serve as trends for how the AEC sector will perform over the coming year, a reading of the ABI can, therefore, inform aspects of architectural business decisions, from who and where to hire, which typology of project to prioritize in bids, or along what timeline initial inquiries may lead to design or construction activity.
You can follow Archinect's ongoing reporting on the AIA Architecture Billings Index here. Do you have further questions or reflections on the ABI? Let us know in the comments.
Niall Patrick Walsh is an architect and journalist, living in Belfast, Ireland. He writes feature articles for Archinect and leads the Archinect In-Depth series. He is also a licensed architect in the UK and Ireland, having previously worked at BDP, one of the largest design + ...
No Comments
Block this user
Are you sure you want to block this user and hide all related comments throughout the site?
Archinect
This is your first comment on Archinect. Your comment will be visible once approved.