
Is it bad news to work for a small firm? How much more do architecture firm workers earn if they have a license? How big is the salary gap between men and women?
ACSA recently visualized nearly 5,000 responses from Archinect's Architecture Salary Poll through a searchable and browsable interactive that focuses on individuals' career stories. We now have three new pages taking a more analytical look at this data, answering questions like these in three areas: firms, job titles and licensure, and gender.
A few highlights are below. If you want more, check out the full piece at ACSA's website.

First, size matters. In the above chart, green indicates higher earnings and red indicates lower earnings; while bar length indicates average satisfaction. Clearly, larger firms tend to pay better. This is a trend also found by the AIA.
The other most striking thing in this chart is firms with 2-5 people seem to have a hard time. Whereas sole practitioners have the highest satisfaction and larger firms earn more money, workers at firms with 2-5 people reported low satisfaction and low pay.

Firm types also differ in terms of their employees. The median salary among the poll's respondents is highest in corporate and starchitect firms, but corporate firm employees reported over two years in experience more, making starchitect firm compensation seem more generous.
Despite this higher pay, starchitect firm employees reported the lowest average satisfaction. In contrast, boutique firm employees reported the highest satisfaction.

Licensed architects generally earn more than their unlicensed colleagues. The salary gap starts small--$2,000 at 3 years of experience--but grows over time. This finding is consistent with data from DesignIntelligence, who found that 70% of firms offer increased compensation upon licensure. They found that most firms--35% in total--offer a base compensation increase of 5 to 9%, while 21% of firms offer smaller increases, 12% of firms offer larger ones, and a few offer a lump sum bonus. 
Given that women are likely to have fewer years of experience than men of the same age, a good way to compare salaries can be by years of experience. In this chart, we can see that even when accounting for different years of experience at each age, a slight gender-based pay gap remains. (The full version of these interactives includes charts covering salary by age, and experience by age for men and women.)
This gap is often small. For example, at 4-5 years of experience the median (middle) man earns $2,000 more per year than his female counterpart. But by 11-15 years of experience this gap has become statistically significant, with a difference of $4,000. A pay gap between men and women of equal years of experience was also found by The Missing 32 Percent.

The curves for both men's and women's job satisfaction start high, are lower in the middle years, and end high. While the dip is moderate--a total drop of 1 satisfaction point for women and 0.6 for men, out of 10--it is statistically significant.
Why is this? We can imagine high satisfaction in the early years being due to youthful optimism, and high satisfaction in the later years due to the pleasures of mastery. Selection also plays a role, since those who don’t enjoy the work may be more likely to leave the profession before reaching their 50s or 60s. These phases of life are not specific to architecture: a study by Princeton University also finds this this U-shaped pattern for overall life satisfaction in the general population.
The other striking pattern in our data is that men in architecture report liking their jobs more than women of the same age, consistently and statistically significantly. This finding is supported by Equity in Architecture Survey 2014, which found that 41% of male respondents but only 28% of female respondents were satisfied at work. What makes this result so notable is that the same study mentioned above found that women in the United States and similar countries are actually happier than men overall.
Finally, our data also shows a brief bump in satisfaction in the 41-45 age range. This may in part be related to general population-wide trends. It's also possible that in the highly cyclical industry of architecture economic peaks and dips have enduring impacts on the achievement and satisfaction of workers on a generational basis.
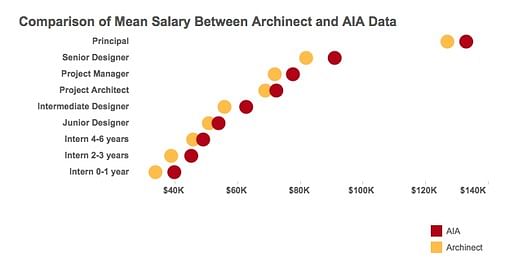
You may be wondering how legit all this data is. We asked the same thing, so as a spot-check, we compared our Archinect numbers with the AIA Compensation Report 2013, based on job titles where there was a close or reasonable equivalent.
Surprisingly consistently across the board, Archinect's earnings numbers are very similar to those from the AIA. Good job, Archineters!
You probably noticed that Archinect's number's are a little lower. AIA's compensation figure includes overtime, bonuses, and other incentives, and this may account for much of the difference. There may also be sampling biases--for example, if those who are unhappy with their salaries because they earn less are more likely to interact with Archinect's poll, then our numbers would be a little lower.
Whew--good work making it through to the end of this post. If you still want more, check out the full interactives on ACSA's website. Thanks again to Archinect for sharing this (totally anonymous) data--and to all of you who responded to the poll!


The Association of Collegiate Schools of Architecture is a nonprofit membership organization, founded in 1912 to advance the quality of architectural education. Our members are over 250 schools, including all accredited programs in the USA and Canada, schools seeking accreditation, and non-accredited and international programs--representing over 40,000 architecture faculty and students.
")
7 Comments
great work, interesting to view it this way.
What does the thickness of the line on the salary / satisfaction graphs indicate? Is that the middle 20% range or such?
I'm surprised to see such variation in satisfaction by market while salaries show no obvious trend. Not what I expected. But some of the differences aren't clear cut: commercial, corporate, developer, and mixed use all seem to overlap.
seems like a bug: on the acsa website some of the salaries show as "$0 per hour". The underlying data does include salary, but it doesn't show on the mouse rollover.
This one for example - sorry just pasted the data in without formatting :P
AgeCityCountryDollar signIDProvinceAgeExperienceFirm SizeFirm Typegender male femalegender man womangraduate_school_combGreetingJob TitleLicenseSalary Timetooltip after gradtooltip firm sizetooltip firm typeTooltip Gradgraduate_school_combTooltip U/Gtooltip yearstooltip_job satisfactiontooltip_marketTooltip_market_spaceUnder Graduate SchoolWork Statuswork_tooltipAvg. Annual Salary EqMedian Annual Salary EqJob Satisfaction (10 Is <3)Salary
36-40Los Angeles US$3695California36-408月10日1sole proprietorshipfemalewomanHi there!Marketing Directorand no licenseper hour, so that means it's just me.I have my own practiceyearsI couldn't be happier at my job. 10 out of 10!$135,200$135,20010$0K
Salary poll looks great.
Great post, very informative!
Ok- good work, but I still have a few suggestions...
Just because someone has worked at a firm for 3 years doesn't necessarily mean that they are at a 3 year level. This, of course is a performance assessment made by firms, but it's important to keep in mind when looking at these numbers. If someone has it in their minds that that at specific times in their career they need to be making X amount, they need to compare that against their performance; i.e. are they really worth the money they think they should be making.
Another comment: maybe there could be an analysis of the billing utilization rate and the salaries. How much of the time spent working is actually billable?
Very interesting.
@midlander - It is just because they are measuring in thousands of dollars. So anyone with an hourly pay gets rounded to $0k/hour.
Thanks for the kind feedback, all!
@midlander @natematt: THANK YOU for the bug report. It's fixed now--salaries now show up unrounded (without the "K" unit) so that folks getting paid hourly have their rate show up correctly.
@BulgarBlogger: Yes, certainly job titles are slippery and a "year 3" person at one firm may not be the same at another firm. Billable hours and other info would be very interesting, if Archinect wants to collect that data in the future. But not every firm tracks that info, right?
Block this user
Are you sure you want to block this user and hide all related comments throughout the site?
Archinect
This is your first comment on Archinect. Your comment will be visible once approved.