
As part of our water system evaluation, monitoring efforts have recently been expanded to include a greywater (water from the bathroom sink, shower, and clothes washer) component. Here we will not be monitoring quality (as we are with rainwater), but rather soil saturation of the greywater bed. To state regulators, this is a primary concern. Discharged greywater must stay below the surface level, and this is what we seek to gain further insight about.
The greywater beds function by layering gravel, mulch, and soil around a perforated 5-gallon reservoir (bucket). As greywater enters the bucket, it is allowed to slowly saturate the sourounding bed. We have designed the bed to hold over 150 gallons of greywater.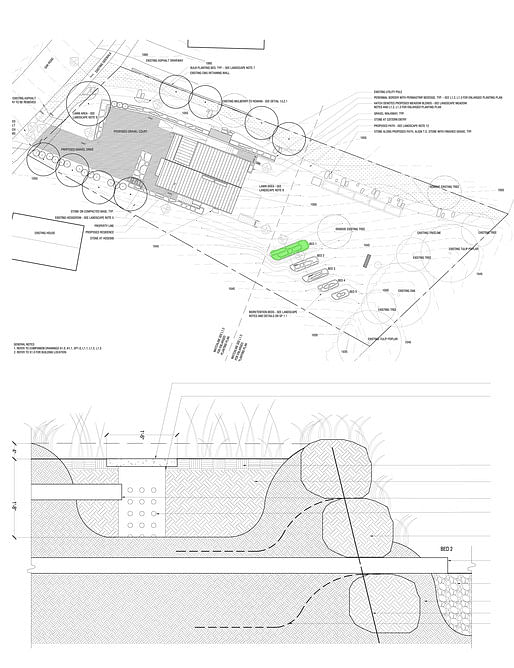 Greywater bed (top, in green) accepts all greywater from the home. A section through the bed itself (below) provides details about how the bed is built up from the subsoil.
What we are interested to learn is how quickly the bed saturates and how quickly it will drain into the subsoil.
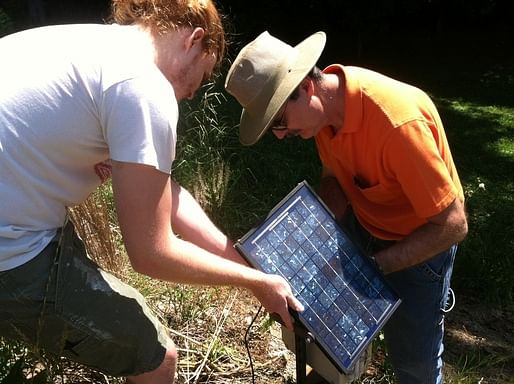
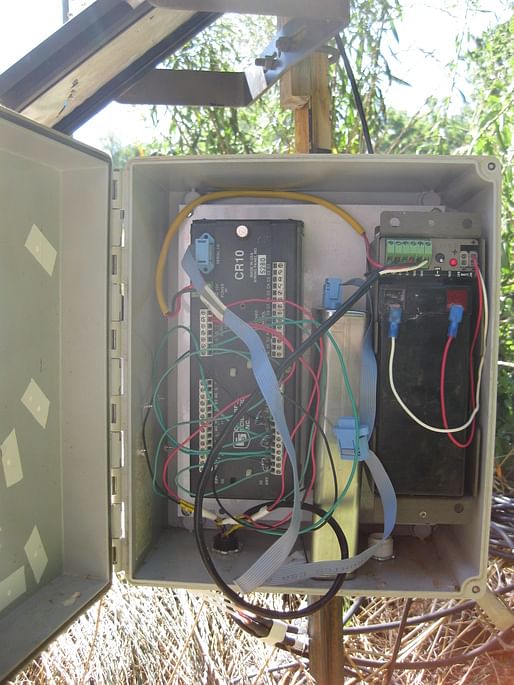
This is where our friends in Biosystems Engineering and Soil Science come in. Working with Dr. John Buchanan we have recently installed a sophisticated monitoring system and have begun analysis of the data. The monitoring system consists of two components:
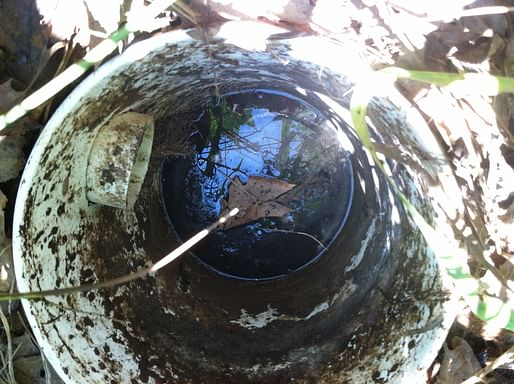
1. Piezometers: Slotted PVC pipe cored 2' into the beds and surrounded with filter sand. Inside of the piezometer is a pressure sensor, which will tell us the water level as it moves up and down within the bed.
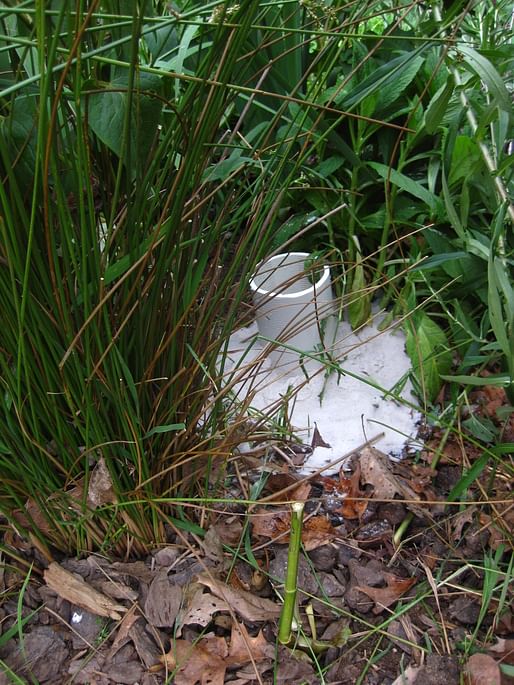
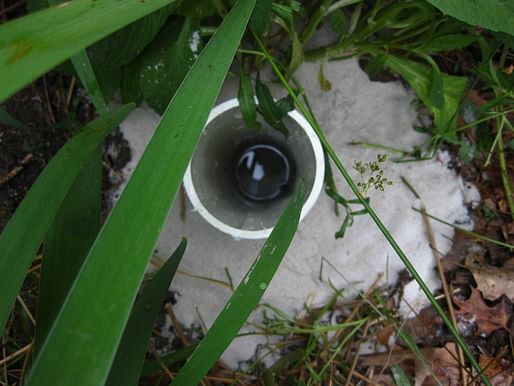
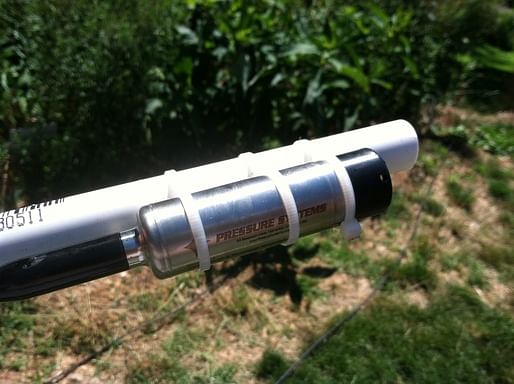
2. A new datalogger: The system is wired to a datalogger that automatically logs water levels within the bed every 2 minutes.
Initial Analysis:
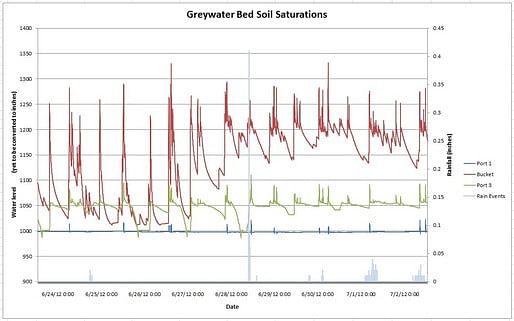
As you can see from the graph below, the water level within the beds fluctuates quite a bit between the 3 testing locations.
NOTES
-The values to the left indicate water level. Currently, the graph is displaying an electrical signal being output by the pressure transducer. This still needs to be analyzed and interpreted to determine actual water level.
-To that same effect, each port needs to be adjusted for the physical elevation of each installed pressure transducer. They are at roughly equal levels, but this will certainly affect the numbers we receive.
-Port #1 (dark blue line) see hardly any greywater at all (as it is on the upslope of the bed).
-Port #3 (green line) shows a water level increase directly correlated to input (bucket- red line), but the space between the two lines clearly shows there is more saturation potential.
-Rainfall (light blue) indicates a possible relationship to the saturation within the bed, but not as much as initially suspected. This will need more data (and more consistent weather).
More to come soon! Thanks for reading!


")


The New Norris House is a design/build effort from the University of Tennessee's College of Architecture and Design. Began in 2009, the home was designed and built by UT students in collaboration with Clayton Homes. The built project is now complete and the final phase of the project has begun. A team of 4 people (2 living in the home, and 2 graduate researchers) will rigorously document the experience via qualitative assessments and quantitative measurements, posting results to this blog.
")
")
2 Comments
As a side note.... who can guess how much storage the datalogger holds (AFTER we supplemented it with an external storage module) before it needs to be downloaded??
...a whopping 200kb. (The silvery brick in the datalogger's enclosure)
interesting project - I'm guessing saturation/drainage also has to do with the composition of the subsoil (and water table)- is it consistent across the site? and what is the composition?
Block this user
Are you sure you want to block this user and hide all related comments throughout the site?
Archinect
This is your first comment on Archinect. Your comment will be visible once approved.