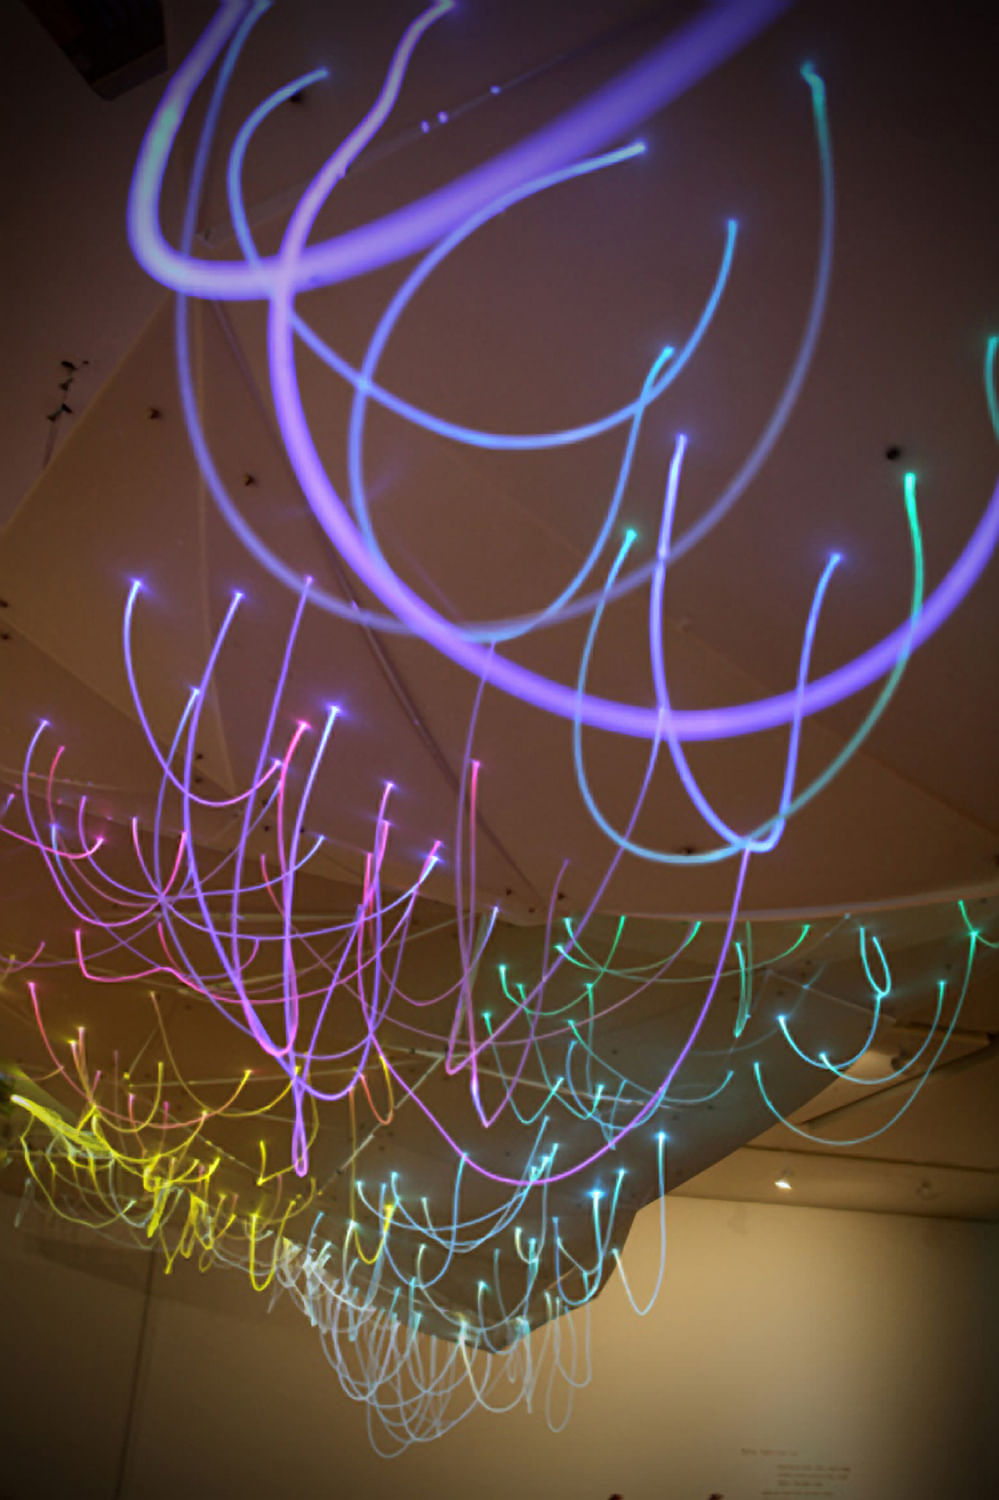
Mood map visualizes the moods of Korean people in color and light through textual analysis of their Tweets on Twitter. A custom software program in Processing searches and analyzes Tweets in Korean language through the Twitter API. Tweets are analyzed using a text analysis library that searches for specific strings of Korean characters that describe certain moods or feelings.
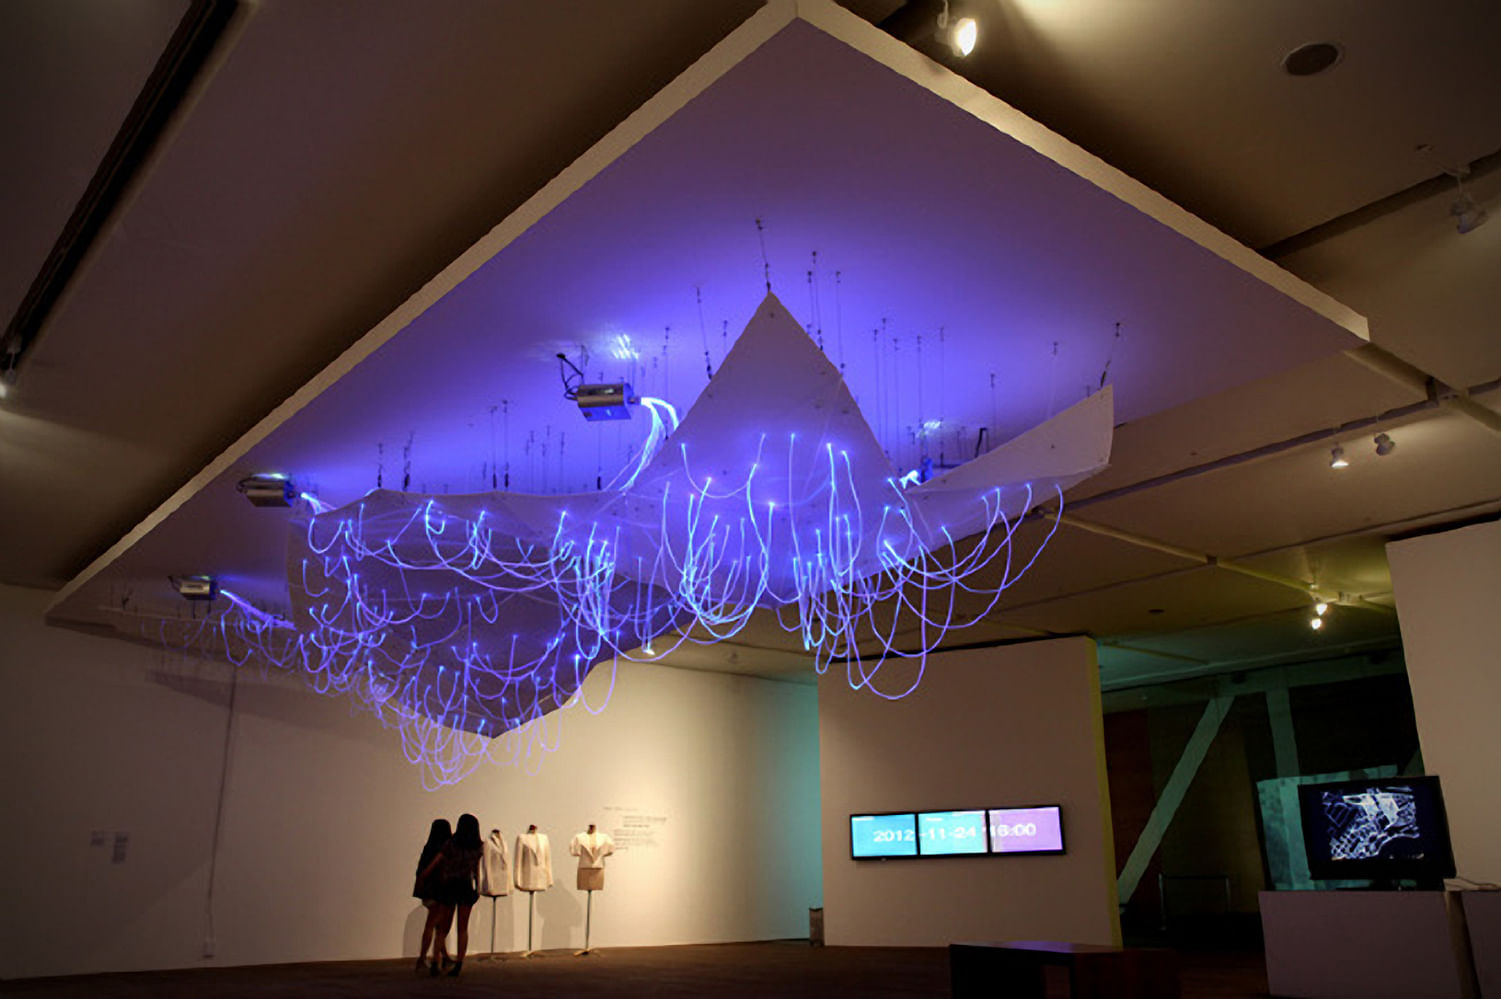
There are six main categories of feelings or moods visualized: joy/pride, love, fear/ shame, anger, pity, and sadness/frustration. Mood Map cycles through three visualization sequences. The first sequence displays occurrences of tweets in real time. The second sequence shows collective data of two moods over the past one hour. And the third shows collective data of one mood in a day. This sequence controls the intensity of color associated with each mood/feeling. The six mood/feeling categories are associated with six fiber optic illuminators, each with a specific color. Each illuminator is paired to two other illuminators through the connection of fiber optic cables. So as the intensity of certain moods changes over time, visitors can witness the relative expression of all the moods compared to each other, changing dynamically over time every 30 seconds. The overall composition will express a flux of mood, feeling, intensity and time transmitted to a three dimensional spatial body.
Mood map was built and exhibited for the “Data Curation” exhibit at the Seoul National University Museum of Art.
Status: Built
Location: Seoul, KR